We re-derived a published figure from the public record.
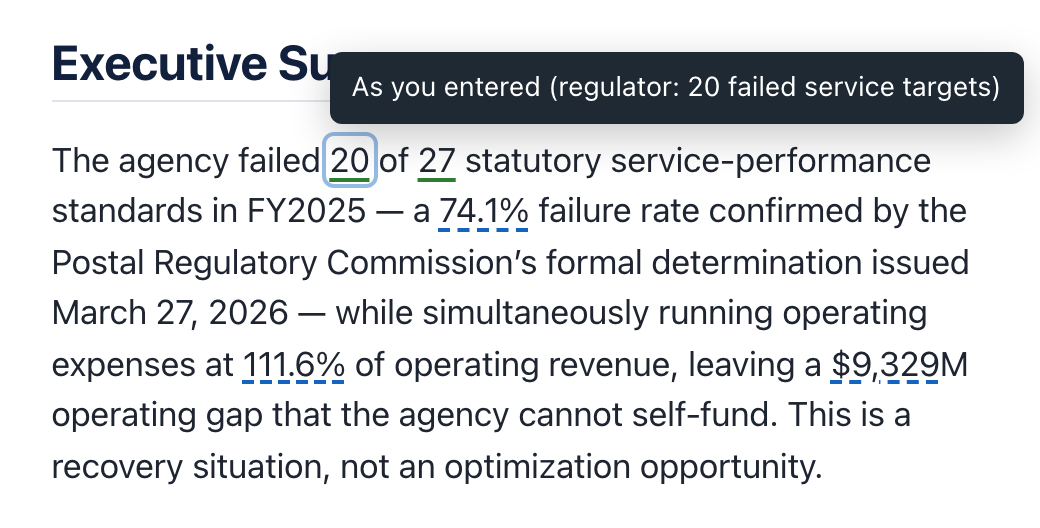
The Postal Regulatory Commission's FY2025 determination publishes three counts: 27 products assessed, 20 failed their delivery targets, and 19 had targets lowered for the year. We entered those counts plus the Postal Service's own 10-K financials, and the report computed the figure neither the agency nor the regulator states: at least 12 products had their targets reduced and missed them anyway. Two sets of 19 and 20 drawn from 27 must overlap by at least 12. Anyone can check it on paper in ten seconds.
The situation
An agency grades itself. A regulator disagrees. The report shows both: side by side.
A congressional oversight committee or a governing board needs one document that holds two publishers to account at once: the U.S. Postal Service reports its own on-time performance, and the Postal Regulatory Commission, a separate federal body, independently determines whether the standards were met. In FY2025 the regulator found 20 of 27 products fell short.
We used the pair as a two-publisher test: enter the regulator's counts and the agency's own financials, attribute every figure to the publisher who stated it, never merge the two, and let the report derive what the published numbers force but neither party says.
What we supplied
Only public inputs, each one sourced.
Every input comes from one of the two public documents: the regulator's determination or the agency's 10-K. We entered the published counts and financial totals; every derived figure below was computed by the report.
| Input | Value | Source |
|---|---|---|
| Products assessed for service performance | 27 | PRC FY2025 ACD, p.73 |
| Products that failed their targets | 20 | PRC FY2025 ACD, p.73 |
| Products with targets lowered for FY2025 | 19 | PRC FY2025 ACD, p.73 |
| Targets lowered by 10+ percentage points | 8 | PRC FY2025 ACD |
| Total operating revenue, FY2025 | $80,453M | USPS FY2025 Form 10-K |
| Total operating expenses, FY2025 | $89,782M | USPS FY2025 Form 10-K |
| Net loss, FY2025 | $8,978M | USPS FY2025 Form 10-K |
| Total mail volume, FY2025 | 108,695M pieces | USPS FY2025 Form 10-K |
Source: PRC FY2025 Annual Compliance Determination · download the source document we used.
The report
The finished, decision-ready output.
This is the actual rendered report, interactive charts and all. Nothing was edited after generation.
Reconcile
Our output vs. the published figures.
| Metric | Published | Ours (computed) | Match | Note |
|---|---|---|---|---|
| Targets lowered AND still missed | Stated by neither USPS nor the PRC | ≥ 12 (20 + 19 − 27) | ✓ exact | Forced by set-overlap arithmetic on the regulator's own counts: check it on paper |
| Standards compliance rate | PRC: 7 of 27 met | 25.9% (7 ÷ 27) | ✓ exact | Computed from the regulator's counts |
| Cost per piece, FY2025 | Not published as a single figure | $0.826 (expenses ÷ volume) | ✓ exact | Derived from two 10-K totals; FY2024 comparison $0.796 derived the same way |
| Products failing FY2025 targets | 20 of 27 (PRC) | 20 of 27 | ✓ | Carried through, attributed to the regulator |
The report keeps the two publishers separate throughout: the agency's reported performance and the regulator's determination appear side by side, attributed by name, never merged. Where the template calls for figures neither publisher provides (per-class unit cost, system uptime), the report says so and omits them instead of estimating; the regulator's own finding that measurement changes inflated reported scores by up to 2.1 points is carried as a caution on the agency's numbers.
Build the same report from your own numbers.
You supply the figures you already have, any gap is filled by an estimate labeled as one, and every number comes back labeled by where it came from so you can put your name on it and show your work.
Generate your report, $199