Decision-ready reports and presentations

We build the report your decision-makers see, not the spreadsheet no one reads.

SectorPrompts is a reporting tool for people who present numbers but aren't full-time analysts. For a board, a committee, a regulator, a council, or a client. Public sector or private.

Start here · free

Your industry's standard KPIs

Pick your industry to see the standard KPIs a board expects and why each one matters, then open one of our published sample reports to see exactly what you'd get.

Free · no account needed

Standard KPIs

View the sample report for this industry

These are the standard KPIs for this industry. When you build a report, you can add your own KPIs on top of the standard set.

See the proof

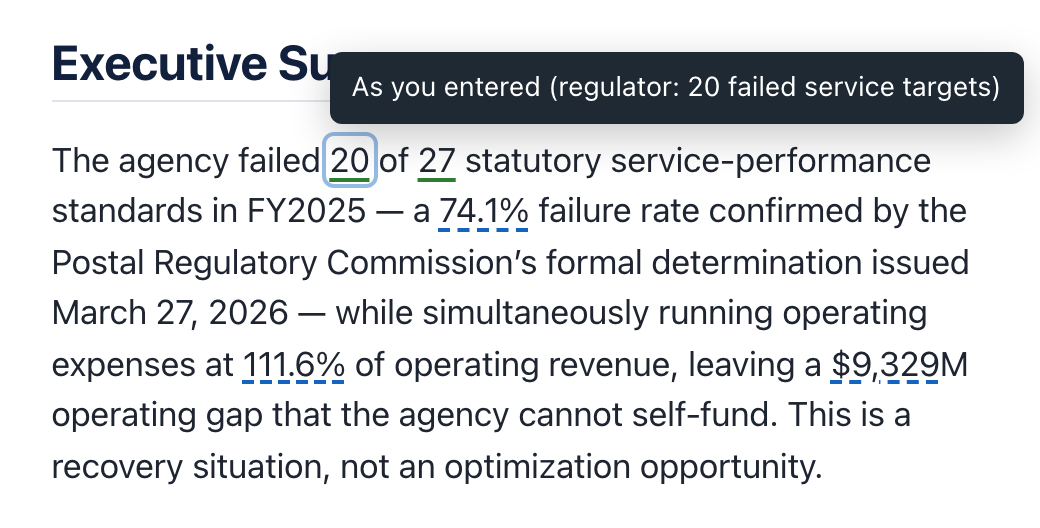
The Postal Service lowered 19 delivery targets. At least 12 were missed anyway — a number nobody published.

20 of 27
postal products failed their FY2025 delivery targets, per the federal regulator
≥ 12
had their targets lowered for the year and still missed them — stated by neither the agency nor the regulator

The Postal Regulatory Commission's FY2025 determination publishes three counts: 27 products assessed, 20 failed their targets, 19 had targets lowered for the year. Two sets of 19 and 20 drawn from 27 must overlap by at least 12 — so at least 12 products had their targets reduced and missed them anyway, a figure neither the agency nor its regulator states. We entered the published counts and the Postal Service's own 10-K financials, and the report computed that number, labeled it, and showed the arithmetic. Anyone can check it on paper in ten seconds. Our figures aren't written to sound right, they're computed to be right.

Read the full sample report  ·  Or the Denver VA cost-growth sample, reconciled to GAO

Built for your field

20 sectors, each built for the numbers you answer for.

Click a report title to start building it, see the suggested KPIs for any sector, or open a sample report where we've published one to view a finished example.

Public Agency Operations Contract Burn & SLA Performance Dashboard Start this report
See the KPIs

Suggested KPIs

  • Contract burn rate: spend pace against the contract term and value.
  • SLA performance: share of service levels met.
  • Cost per service transaction: efficiency of delivering a unit of public service.
  • Backlog / cycle time: how long requests take and how many are waiting.
  • Budget utilization: spend against appropriation, on pace or not.
  • Service quality / satisfaction: whether the public is actually served well.
Sample report
Capital Project Oversight Contractor Cost & Schedule Performance Review Start this report
See the KPIs

Suggested KPIs

  • Cost Performance Index (CPI): whether you're getting a dollar of work for each dollar spent; the earliest budget warning.
  • Schedule Performance Index (SPI): whether work is keeping pace with the plan.
  • Cost Variance (CV): the overrun or saving in real dollars.
  • Schedule Variance (SV): how far ahead or behind, in budget terms.
  • Estimate at Completion (EAC): projected final cost if performance holds. The number every board asks for.
  • Change Order Rate: approved changes as a share of the original contract; flags scope creep.
  • Percent Complete: earned progress against baseline; the anchor for everything else.
Sample report
Clean Energy & ESG Carbon Tracking & ESG Compliance Scorecard Start this report
See the KPIs

Suggested KPIs

  • Scope 1, 2 & 3 emissions: direct, energy, and value-chain carbon; the baseline of any credible disclosure.
  • Emissions intensity: carbon per unit of output or revenue; lets a board compare year over year.
  • Energy intensity: energy per unit of output; ties environmental performance to cost.
  • Reduction vs. target: progress against a stated commitment; what turns a metric into a KPI.
  • Water and waste metrics: consumption and diversion rates; material for many disclosure frameworks.
  • Framework alignment: coverage against the standard that binds you (CSRD, IFRS, SASB, GRI); keeps it audit-ready.
Sample report
Cybersecurity Threat Response & Compliance SLA Report Start this report
See the KPIs

Suggested KPIs

  • Mean Time to Detect (MTTD): how fast threats are spotted; the core test of monitoring.
  • Mean Time to Respond / Contain (MTTR): detection to containment; tied to how much damage occurs.
  • Critical vulnerability closure rate: share of critical findings fixed within policy timeframes.
  • SLA compliance rate: incidents handled within contracted windows; what a regulator checks first.
  • Incident volume by severity: the shape of the threat load, not just isolated events.
  • Framework coverage: controls implemented and evidenced; turns "compliant" into a number.
Sample report
Real Estate & Facilities Property NOI & Tenant Retention Optimizer Start this report
See the KPIs

Suggested KPIs

  • Net Operating Income (NOI): income after operating expenses; the foundation of valuation.
  • Occupancy rate: leased and occupied space; directly drives revenue.
  • Lease renewal rate: share of expiring leases that renew; the cheapest occupancy to hold.
  • Tenant turnover rate: how often tenants leave; a cost driver disguised as an occupancy stat.
  • Rent collection / delinquency: collected rent and arrears; a liquidity and tenant-health signal.
  • Operating expense ratio: costs as a share of revenue; shows what NOI alone can hide.
Sample report
Telecom Network Performance & Churn Modeler Start this report
See the KPIs

Suggested KPIs

  • Churn rate: share of subscribers lost per period; the make-or-break metric.
  • Average Revenue Per User (ARPU): revenue efficiency per subscriber.
  • Network availability / uptime: whether the service is reliably there.
  • Latency / throughput: the performance customers experience.
  • Customer acquisition cost: cost to win each new subscriber.
  • Net Promoter Score: whether subscribers would recommend you; a churn predictor.
Sample report
Advanced Business Unit Economics & Break-Even Modeler Start this report
See the KPIs

Suggested KPIs

  • LTV:CAC ratio: lifetime gross profit per dollar of acquisition; the most-cited health metric (3:1 is the benchmark).
  • Customer Acquisition Cost (CAC): fully loaded cost to win one customer.
  • CAC payback period: months to recover acquisition cost; under 18 is healthy.
  • Gross margin: profit kept after delivering the product; anchors real unit economics.
  • Contribution margin: revenue minus variable cost per unit; what actually covers overhead.
  • Break-even point: the volume or date where revenue covers fixed and variable cost.
Sample report
AI/ML Operations Model Performance & Inference Cost Tracker Start this report
See the KPIs

Suggested KPIs

  • Model accuracy / performance: whether the model does its job at the required quality bar.
  • Inference cost per request: unit economics of running the model in production.
  • Latency (p95/p99): response time at the tail; what users actually feel.
  • Model drift rate: how fast performance degrades as data shifts; triggers retraining.
  • Compute utilization: how efficiently expensive hardware is used.
  • Uptime / availability: whether the service is there when called.
Capital Programs & Infrastructure Infrastructure Funding & Milestone Burn Tracker Start this report
See the KPIs

Suggested KPIs

  • Funding drawdown vs. schedule: how fast allocated funds are spent against plan.
  • Milestone completion rate: share of milestones hit on time; a delivery-health signal.
  • Budget variance: committed and spent versus appropriated.
  • Obligation rate: funds committed against funds available; watched closely in public programs.
  • Cost-to-complete forecast: remaining spend to finish the program.
  • Grant / match compliance: whether matching and use-of-funds conditions are met.
Sample report
Defense & Aerospace EVM S-Curve & Cost Performance Analyzer Start this report
See the KPIs

Suggested KPIs

  • Cost Performance Index (CPI): cost efficiency against the baseline.
  • Schedule Performance Index (SPI): schedule efficiency against the baseline.
  • Estimate at Completion (EAC): forecast total cost; central to program reviews.
  • To-Complete Performance Index (TCPI): the efficiency needed on remaining work to hit target.
  • Variance at Completion (VAC): projected overrun or underrun at the end.
  • Management reserve status: contingency remaining against risk ahead.
Sample report
Education & Workforce Learning Funnel & Certification Outcomes Tracker Start this report
See the KPIs

Suggested KPIs

  • Learning funnel conversion: how many move from interest to enrolled to completed.
  • Completion / graduation rate: share who finish the program.
  • Certification pass rate: share achieving the credential; the outcome funders pay for.
  • Job placement rate: share placed in relevant roles after completion.
  • Cost per completion: program spend divided by successful completers.
  • Learner satisfaction / retention: whether participants stay and would recommend.
Sample report
Executive Communications Stakeholder Trust & Message Resonance Scorecard Start this report
See the KPIs

Suggested KPIs

  • Message reach: how many of the intended audience were exposed.
  • Engagement rate: share who acted on or interacted with the message.
  • Stakeholder trust / sentiment: measured shift in how key audiences view leadership.
  • Message resonance: whether the intended takeaway was actually received.
  • Response / action rate: share who did the thing the message asked for.
  • Channel effectiveness: which channels drove the outcome, so spend follows results.
Financial Services & Fintech Fraud Exposure & Regulatory Capital Monitor Start this report
See the KPIs

Suggested KPIs

  • Fraud loss rate: losses as a share of transaction volume; the core exposure metric.
  • False positive rate: legitimate transactions wrongly flagged; a customer-friction cost.
  • Regulatory capital ratio: capital held against risk-weighted assets versus the required floor.
  • Chargeback rate: disputed transactions as a share of volume.
  • KYC/AML alert clearance rate: how efficiently compliance alerts are resolved.
  • Net interest margin / take rate: the core revenue-efficiency measure for the model.
Sample report
Government Consulting Audit Findings & Remediation Tracker Start this report
See the KPIs

Suggested KPIs

  • Audit findings count and severity: open findings banded by risk; the headline for oversight.
  • Remediation closure rate: share of findings resolved within committed timeframes.
  • Time to remediate: average days from finding to closure.
  • Recurring finding rate: findings that reappear; a systemic-weakness signal.
  • Corrective action plan completion: share of CAP milestones met.
  • Compliance coverage: share of applicable requirements assessed and evidenced.
Sample report
Government Contracting Delivery Performance & Subcontracting Compliance Tracker Start this report
See the KPIs

Suggested KPIs

  • On-time delivery rate: share of deliverables met by the contracted date.
  • Cost variance against contract value: spend versus the negotiated ceiling.
  • Subcontracting plan compliance: small-business and set-aside goals met versus committed.
  • CPARS / performance rating: the past-performance score that drives future awards.
  • Deliverable acceptance rate: share accepted without rework.
  • Invoice accuracy / DSO: billing correctness and days to get paid.
Sample report
Healthcare & Life Sciences Patient Outcome & Readmission Flow Analyzer Start this report
See the KPIs

Suggested KPIs

  • Readmission rate: share readmitted within the window; a core quality and penalty metric.
  • Patient outcome / recovery rate: whether care achieves the intended clinical result.
  • Average length of stay: efficiency and cost signal per episode of care.
  • Patient satisfaction (HCAHPS): experience scores tied to reimbursement.
  • Cost per case / episode: spend to deliver a unit of care.
  • Compliance / adverse event rate: safety and regulatory exposure.
Sample report
Justice & Public Safety Recidivism Reduction & Program Outcomes Modeler Start this report
See the KPIs

Suggested KPIs

  • Recidivism rate: share who reoffend within the window; the outcome that defines success.
  • Program completion rate: share who finish the intervention.
  • Time to case resolution: how long matters take to move through the system.
  • Cost per participant / outcome: spend against results, not just activity.
  • Program participation rate: reach into the eligible population.
  • Post-program employment / stability: downstream outcomes that predict lasting change.
Sample report
Organizational Strategy Workforce Transformation Adoption & Retention Tracker Start this report
See the KPIs

Suggested KPIs

  • Adoption rate: share of the workforce actually using the new way of working.
  • Employee retention rate: whether the change is keeping or losing people.
  • Engagement score: measured workforce sentiment during transformation.
  • Time to proficiency: how fast people reach full productivity on the new model.
  • Change readiness index: whether the organization is prepared before rollout.
  • Realized benefit vs. plan: the value the transformation was supposed to deliver.
Sample report
Project Management Earned Value & Resource Burn Calculator Start this report
See the KPIs

Suggested KPIs

  • Earned Value (EV): budgeted value of work actually completed.
  • Cost Performance Index (CPI): cost efficiency against plan.
  • Schedule Performance Index (SPI): schedule efficiency against plan.
  • Resource utilization: how fully the team's capacity is being used.
  • Milestone hit rate: share of milestones delivered on time.
  • Budget burn rate: how fast the budget is consumed versus progress.
Sample report
Supply Chain & Logistics Perfect Order & Lead Time Performance Dashboard Start this report
See the KPIs

Suggested KPIs

  • Perfect order rate: share delivered complete, on time, undamaged, and accurate.
  • On-time in-full (OTIF): the delivery-reliability benchmark customers hold you to.
  • Order cycle / lead time: how long from order to delivery.
  • Inventory turnover: how efficiently stock converts to sales.
  • Fill rate: share of demand met from available stock.
  • Freight cost per unit: the cost efficiency of moving goods.
Sample report

One price. The framework, the numbers, the finished deliverable.

$199one-time · no subscription, ever
  • A KPI framework generated for your exact situation: audience, compliance standard, maturity, objective
  • Your real figures filled in and fully calculated
  • Every figure labeled as your input, an assumption, or a calculation that traces to your data
  • The narrative and charts built out, plus a full provenance appendix
  • Your finished report or deck in HTML, every theme included
  • Two revisions included over 30 days: adjust your inputs and regenerate, three versions in all

Add-ons at checkout

Your report or deck in Word, PDF, and PPTX$49
Build my report or deck, $199

Because every figure is labeled — your input, a stated assumption, or a calculation from your data — a revision isn't fixing a mystery number, it's you refining your own inputs.

Government agency? We accept purchase orders. Contact us to arrange a PO.

Student? The complete package is $29: your report or deck, all download formats (Word, PDF, PPTX), and two revisions within 30 days. Sign-up requires a valid educational institution email address; personal addresses such as Gmail aren't eligible.

Already have a document going out under your name?

Want us to check your work?

Upload a finished document and we run the most skeptical review we can build against it: figures whose own stated components imply a different number, statements that don't agree with each other, figures with no identifiable source, and leftover drafting artifacts. Every finding quotes your document so you can check it yourself, and the review tells you what it did and didn't examine. You see what the hardest reader in the room would find, before they do.

See what a review finds

Example findings from a quarterly business update. Figures illustrative.

Contradicted. The update states an operating margin of 18.9 percent, but the revenue and cost figures printed in the same document imply 17.6 percent. Both numbers are shown with where they appear, because an analyst will run this math in the first five minutes.

Inconsistent. Page 2 calls a metric a record; page 8 shows a higher figure for a prior quarter. Internal contradictions like this cost more credibility than the metric is worth.

Unsourced. A $2.1M savings figure appears in the summary with no source anywhere in the document — no calculation, no citation, nothing to point to when someone asks where it came from.

Coverage. Every review closes by stating which sections were examined and which weren't, so a clean result means something.

Your first review is free. Reviews after that are $49 each.

Check my work

Findings show on your screen only. Nothing is published or shared.

Questions

The things accountable people ask first.

What's actually free?
Two things, no account needed. First, the suggested KPIs for every sector: the metrics a board expects for that field and why each one matters, right on this page. Second, our published sample reports, each one rebuilt from a public document and reconciled back to it, so you can see exactly what the deliverable looks like before you spend a dollar. Everything generated for you personally, the framework built for your exact situation, your numbers calculated, the finished report or deck, is the $199 step.
What do I get for $199?
The whole build, one time. Answer structured questions about your situation, your audience, compliance framework, maturity, and objective, and the tool generates a KPI framework for exactly that. Then your figures go in, every number is calculated and labeled by source, and you get the finished report or deck in HTML with a full provenance appendix and two revisions included over the next 30 days. Word, PDF, and PPTX versions are available as a $49 add-on.
Is there a student price?
Yes. Students get the complete package for $29: the full report or deck build, all download formats (Word, PDF, PPTX), and two revisions within 30 days. You must sign up with a valid educational institution email address; personal email addresses such as Gmail aren't eligible.
Do I get a report or a slide deck?
Whichever you need. Both are built from the same figures, so the numbers stay consistent whichever format you present. Both are delivered in HTML. Word and PDF for reports, and PPTX for slide decks, are available together as a $49 add-on.
How do I know it's not making the numbers up?
It can't, and that's the design. Every figure is labeled by where it came from: a number you entered, an assumption we label as an assumption, or a calculation that traces back to your inputs. Hover any figure to see its source or formula, and the appendix lists every input, assumption, and calculation, so anyone can re-derive the numbers by hand. Unlike a general AI, which generates plausible-looking numbers that change every time you ask, here every figure is traceable and the same inputs always produce the same figures.
Is it good enough for a board, a committee, or a regulator?
It's built for exactly that. See the Capital Oversight sample, where the report recomputes the GAO's published figure for the $1.73 billion Denver VA hospital from the same inputs. Each sector is built to cite the standards and sources it works from. As with any deliverable, always check your work when you receive it: review the report and verify any anomalies or items specific to your situation before you present. The provenance labels make that check fast, since every figure shows exactly where it came from.
I'm not technical and I can't prompt AI. Can I still use it?
Yes. Everything is structured dropdowns and short questions, no prompting, no formulas. You choose your situation, the tool proposes the framework, and you supply the figures it asks for. What comes back is a finished, decision-ready report or deck.

Start with the right numbers.

The KPIs and sample reports are free, see what your audience expects before you spend a dollar. Then $199, one-time, builds your own report or deck. No subscription, ever.

View the sample report

Enter your work email and we'll open the sample for this sector.

Nothing you enter is published or shared.